Executive Summary
The Problem:
- Property taxes in Wyoming are unaffordable and make buying a home or starting a business more costly or outright impossible for many people. The surge in spending by local governments has resulted in increased property taxes, while the state government’s exorbitant expenditures have constrained the funds available to lower them.
- From 2000 to 2023, total property taxes increased by $1.7 billion (+316%), including increases of $136.6 million (+381%) by special purpose districts, $293.3 million (+321%) by counties, $1.2 billion (+309%) by school districts, and $30.3 million (+298%) by municipalities. These property taxes have grown substantially faster than increases in personal income (+206%) and far faster than the rate of population growth plus inflation (+91%) during this period. This results in unaffordable property taxes for most people.
- More recently, total property taxes increased much faster from 2021 to 2023, increasing by $912.3 million (+71%), 54% of the total increase since 2000. This total includes increases in school property taxes of $676.3 million (+73%), county property taxes of $161.6 million (+73%), special district taxes of $64.8 million (+60%), and municipal taxes of $9.6 million (+31%). In contrast, population growth plus inflation increased by +17%, and personal income grew by +9% during this period. Wyoming’s population growth was up 0.6%, and inflation was up 16.3% from 2021 to 2023.
- From 2021 to 2023, inflation-adjusted personal income declined by 8%. Despite this loss in purchasing power, property taxes were up an average of 71%, proving to be a crushing, unsustainable burden. This burden also passes through in higher prices paid by housing and commercial property renters. The problem affects every person’s quality of life and ability to do business in Wyoming.
- Bold reforms are necessary to restrain government spending at the state and local levels and use the resulting surplus taxpayer money to reduce property taxes until they are zero. These are similar to what has been worked on in Texas, but Wyoming can be the national leader in helping people stop paying rent to the government forever through property taxes, and instead begin to own their property.
The Three-Step Solution
Our proposal turns restrained government spending into a direct benefit to those with property in Wyoming and a benefit to those without property who rent or lease. Whether someone has property or rents it, every person’s living standard is affected by property costs, including the burden of property taxes. The reform applies to all categories of property taxpayers, including residential, commercial, mining, and agricultural – everyone benefits.
Limiting government spending can create surpluses, which this proposal uses to put money back into all taxpayers’ pockets. By reducing property taxes, three steps will provide cost-of-living benefits to all Wyoming citizens, families, and businesses.
Step 1 – Spend Less: New state spending law, followed by an immediate constitutional amendment referral.
Pass a strong spending limit that sets the maximum for state spending changes to be no greater than the rate of population growth plus inflation (PGI). To account for budget contingencies or higher spending and taxes for specific purposes, the law allows the legislature to exceed the limit (but not change the PGI formula) in any budget cycle with the approval of a two-thirds vote of both chambers. This analysis shows the recommended PGI spending limit cap will sufficiently fund limited government spending now and over time while contributing to state surpluses from faster growing tax revenue than this cap.
Step 2 – Tax Less: 90% of state surpluses resulting from a spending growth limit (PGI) go directly to taxpayers by reducing school property taxes to offset the funding for school districts.
Considering data from 2017 to 2023, Wyoming’s state general fund revenue grew, on average, by 7.5% per year, 4.3 percentage points faster than the 3.2% average rate of population growth plus inflation (PGI). If annual state spending had been capped at the PGI rate of 3.2%, there would have been large surpluses of tax revenue (taxpayer money) available to return to taxpayers through reductions in school property taxes.
To be fiscally prudent, we consider only 90% of a surplus to be used to ‘buy down’ school property tax rates; 10% is to be held in reserve to be added to state revenue the next fiscal year for any revenue volatility. No surplus, no property tax reductions. If state revenue declines, the available surplus drops – less revenue can be used to offset school property taxes. This reform feature makes property tax relief contingent on spending restraint and the economic situation. School property tax relief slows or stops if the state does not restrain spending or suffers revenue declines from general economic conditions.
Step 3 – Limit Government: State and local funds available if more taxes are needed.
Suppose the Legislature determines the state needs more money for specific purposes, including for public education, than is available under the PGI spending limit, the Legislature can exceed the cap with a two-thirds vote of each chamber. This vote requirement makes spending and, thus, tax increases completely transparent to voters.
For local governments other than school districts, such as counties, municipalities, or special districts, a separate reform law should be enacted with a strong ‘truth-in-taxation’ clause requiring all local governments to ask for voter approval of the requested increase in a uniform November election. The reform gives local voters control over their taxation, reversing the current one-sided model in which local officials develop budgets behind closed doors and then impose the taxation on voters without their consent or consideration of their finances or ability to pay.
Local governments have other sources of revenue besides property taxes. Accordingly, we recommend that these entities adopt the same PGI spending cap limit as the state, even if it is not imposed by state law. Localities should have sufficient funding from local taxes to cover their spending priorities; however, if they decide they need more taxpayer money, they should be required to seek voter approval for any increases in property taxes from a vote held in a uniform November election.
Limiting local government spending to the same PGI spending growth limit as the state and requiring a local vote to approve any increase in their (non-school) property taxes should force local government budget discipline and generate surpluses. Just as at the state level, these surpluses should be used to reduce local (non-school) property taxes every year until they are eliminated. This proposed local spending limit would not apply to school districts; based on the state’s existing school finance formulas based on enrollment and other factors, the state will continue to fully fund the districts over time. As explained above, state revenue and additional state surpluses would reduce and eventually eliminate school property taxes.
Outcome
Implementing these bold fiscal reforms for the state and local government in Wyoming will gradually bring people and businesses closer to owning their homes and properties outright, with the government having no claim on them for taxes (or unpaid taxes!). Contrast this outcome with their situation today, where, in effect, they ‘rent forever’ and are subject to large penalties or seizure for not paying all property taxes in full when due.
In America, everyone has a God-given right to own property. This proposal returns that right to them!
Wyoming’s Economy
From 2000 to 2022, Wyoming’s personal income per capita increased substantially from $29,426 in 2000 to $73,248 in 2022.[i] This 149% increase was nearly twice as fast as the 82% increase in the state’s population growth plus inflation (PGI), as measured by the chained-consumer price index (CPI) for all urban households, meaning inflation-adjusted personal income per capita grew substantially. Wyoming’s population rose by an average of 0.7% over the period. However, while this population increase was positive in the last two years, it declined in four of the prior five years. Inflation averaged an increase of 2.2% in the period, resulting in a summed amount with population growth of a 2.9% annual increase since 2000. See Table A in the Appendix for more comparisons of Wyoming with other states.
In 2022, Wyoming had the second smallest state economy in the country at $36.4 billion[ii] but the thirteenth-highest inflation-adjusted (real) gross domestic product per capita at $62,517.[iii] Last year, the state’s economy had the sixth worst GDP growth rate at -0.1%.[iv] Median household income was the 26th highest at $73,090.[v] The Fraser Institute’s index of economic freedom—based on measures in categories of government spending, taxation, and labor market regulation—ranks Wyoming 18th.[vi]These data indicate some strengths, but we must acknowledge that declines in economic growth and essentially flat population growth in recent years are reasons for great concern.
Property Taxes Are Too High In Wyoming
One of the major burdens on taxpayers is local property taxes. Wyoming does not have statewide property taxes, but the local governments can levy property taxes based on a mill of $1 worth of taxes for every $1,000 property valuation. Table 1 shows that property taxes in 2023 totaled $2.2 billion, with $1.6 billion for schools (73%), $384.5 million for counties (17%), $172.5 million for special districts (8%), and $40.5 million for municipalities (2%).[vii]
Table 1. Property Tax Collections in Wyoming Since 2000
| Tax Year | Special District Taxes | County Taxes | Municipal Taxes | School Taxes | Total Property Taxes |
|---|---|---|---|---|---|
| 2000 | $ 35,821,372 | $ 91,245,828 | $ 10,189,213 | $ 392,165,577 | $ 529,421,990 |
| 2001 | $ 44,955,700 | $ 121,296,576 | $ 10,958,413 | $ 518,723,972 | $ 695,934,661 |
| 2002 | $ 46,910,113 | $ 128,367,852 | $ 11,386,697 | $ 536,788,327 | $ 723,452,989 |
| 2003 | $ 46,860,890 | $ 119,082,631 | $ 12,204,405 | $ 490,819,233 | $ 668,967,159 |
| 2004 | $ 58,903,817 | $ 158,215,719 | $ 13,110,362 | $ 642,943,176 | $ 873,173,074 |
| 2005 | $ 69,518,104 | $ 190,355,489 | $ 14,493,894 | $ 770,575,327 | $ 1,044,942,814 |
| 2006 | $ 89,250,890 | $ 245,426,871 | $ 16,191,853 | $ 980,132,486 | $ 1,331,002,100 |
| 2007 | $ 95,130,951 | $ 255,109,317 | $ 18,786,210 | $ 1,007,898,085 | $ 1,376,924,563 |
| 2008 | $ 104,199,271 | $ 257,315,224 | $ 21,362,225 | $ 1,025,256,292 | $ 1,408,133,012 |
| 2009 | $ 131,631,016 | $ 339,582,089 | $ 22,550,689 | $ 1,357,680,471 | $ 1,851,444,265 |
| 2010 | $ 104,394,010 | $ 246,098,026 | $ 22,383,177 | $ 989,609,943 | $ 1,362,485,156 |
| 2011 | $ 110,090,503 | $ 282,071,242 | $ 22,432,613 | $ 1,131,179,096 | $ 1,545,773,454 |
| 2012 | $ 115,860,848 | $ 292,611,518 | $ 22,802,437 | $ 1,174,767,844 | $ 1,606,042,647 |
| 2013 | $ 109,386,629 | $ 264,971,680 | $ 23,539,160 | $ 1,065,622,091 | $ 1,463,519,560 |
| 2014 | $ 114,139,191 | $ 281,119,104 | $ 24,604,903 | $ 1,132,248,596 | $ 1,552,111,794 |
| 2015 | $ 120,597,607 | $ 302,722,914 | $ 25,505,176 | $ 1,219,200,809 | $ 1,668,026,506 |
| 2016 | $ 98,786,073 | $ 242,283,580 | $ 26,208,055 | $ 981,222,658 | $ 1,348,500,366 |
| 2017 | $ 92,155,264 | $ 217,917,155 | $ 26,939,626 | $ 886,255,582 | $ 1,223,267,627 |
| 2018 | $ 101,470,124 | $ 239,394,522 | $ 27,456,847 | $ 976,010,614 | $ 1,344,332,107 |
| 2019 | $ 111,677,497 | $ 262,814,372 | $ 28,588,432 | $ 1,069,507,094 | $ 1,472,587,395 |
| 2020 | $ 113,250,804 | $ 257,517,316 | $ 29,801,891 | $ 1,058,585,111 | $ 1,459,155,122 |
| 2021 | $ 107,641,168 | $ 222,893,149 | $ 30,942,924 | $ 925,973,382 | $ 1,287,450,623 |
| 2022 | $ 139,541,449 | $ 297,814,883 | $ 36,300,597 | $ 1,254,644,200 | $ 1,728,301,129 |
| 2023 | $ 172,469,688 | $ 384,540,300 | $ 40,506,696 | $ 1,602,252,922 | $ 2,199,769,606 |
Using 2000 as the base year when the data are normalized to 100, Figure 1 below shows how these property taxes have outrun total personal income growth and PGI.[viii]
Figure 1. Property Taxes Grew Substantially Faster Than Incomes in Wyoming since 2000 (Index values are normalized to 100 in 2000 for comparison)
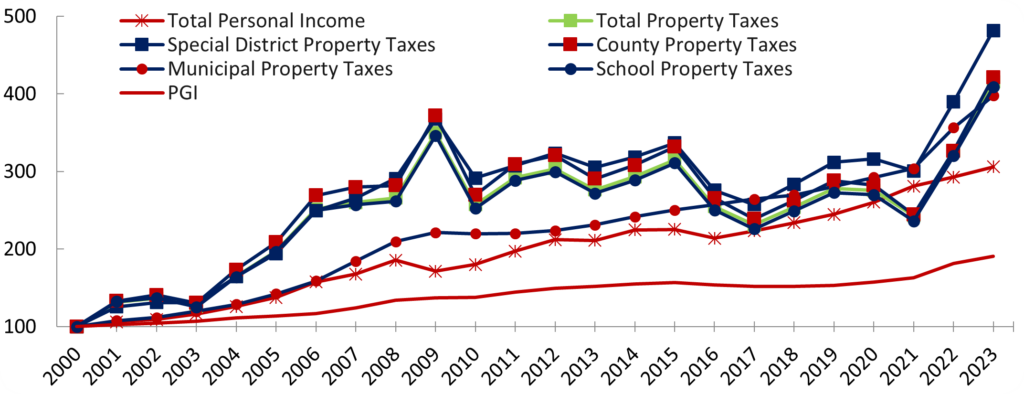
While property taxes grew more rapidly from 2000 to 2009, they flattened from 2009 to 2021. However, Figure 2 illustrates how property taxes have skyrocketed by 71% since 2021 compared with increases of 17% in the rate of population growth plus inflation PGI and just 9% growth in total personal income. The result is an 8% decline in inflation-adjusted personal income over this period. These data show how much more property taxes have increased than the average taxpayer’s ability to pay for them. This unaffordable situation for Wyoming’s taxpayers must be addressed.
Figure 2. Property Taxes Have Increased Much Faster Than Wyoming’s Ability to Pay for Them, 2021-23
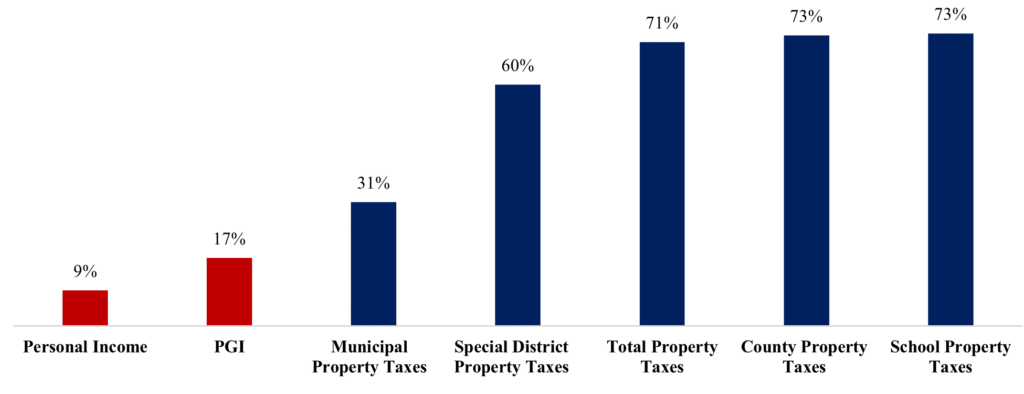
Figure 3 shows the growth of these variables since 2000 for a picture of how much faster property taxes have increased compared to total personal income and the rate of population growth plus inflation over a longer time horizon.
Figure 3. Property Tax Growth Has Long Outpaced Wyoming’s Ability to Pay for Them, 2000-2023
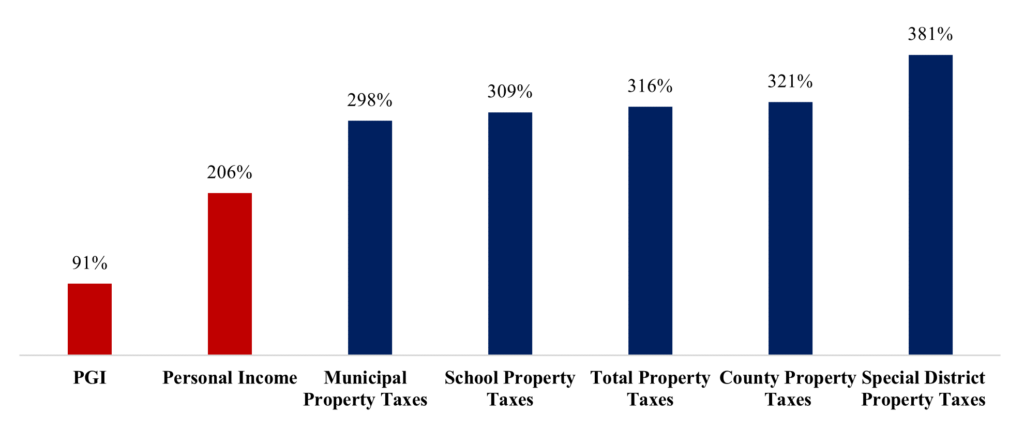
Figure 4 shows that, on a compounded average annual growth rate, people’s wages have not kept up with the growth in property taxes since 2000.
Figure 4. Compounded Average Annual Growth Rates Show How Unaffordable Are Property Taxes for People in Wyoming, 2000-2023
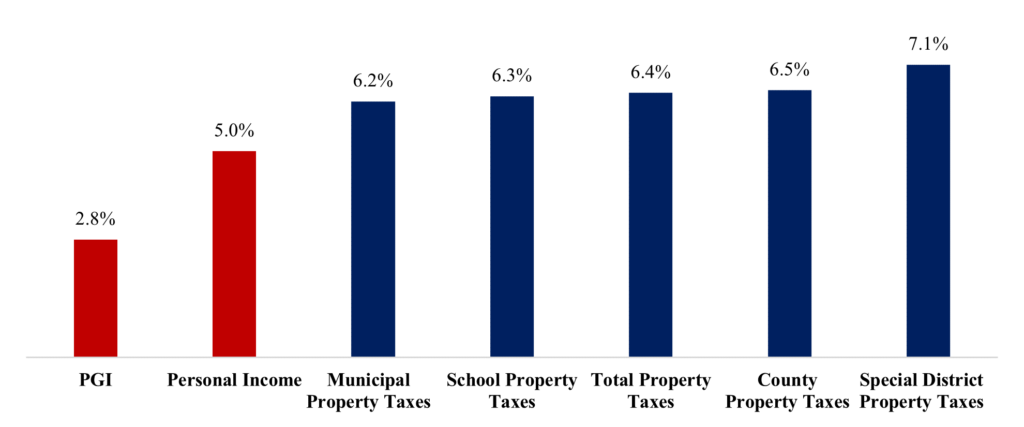
These data show that total property taxes grew more than twice as fast as the rate of population growth plus inflation (PGI) and 28% faster than personal income growth.
While property taxes in each of these local tax jurisdictions are growing faster over this period than these two key metrics, special district property taxes are growing the fastest but are just 8% of all property taxes. Others are also growing fast, but county property taxes are 17%, and municipal property taxes are 2% of total property taxes. School property taxes are the largest share of property taxes at 73%, so this increase hurts property taxpayers the most.
In the last year, from 2022 to 2023, Table 2 notes that total property taxes are up 27.3%. This far outpaces personal income growth of about 4.5% and the rate of population growth plus inflation of about 5% in that year.
Table 2. Property Tax Comparison by County, All Taxes Levied
| 2022 Property Taxes | 2023 Property Taxes | Change | % Change | |
|---|---|---|---|---|
| Albany | $40,715,921 | $46,207,210 | $5,491,289 | 13.5% |
| Big Horn | $18,361,831 | $22,192,387 | $3,830,556 | 20.9% |
| Campbell | $287,294,406 | $359,173,235 | $71,878,829 | 25.0% |
| Carbon | $54,245,447 | $66,085,230 | $11,839,783 | 21.8% |
| Converse | $166,193,905 | $261,314,702 | $95,120,797 | 57.2% |
| Crook | $16,680,672 | $20,822,667 | $4,141,995 | 24.8% |
| Fremont | $62,014,671 | $77,736,622 | $15,721,951 | 25.4% |
| Goshen | $18,710,927 | $21,382,729 | $2,671,802 | 14.3% |
| Hot Springs | $11,546,200 | $14,964,237 | $3,418,037 | 29.6% |
| Johnson | $25,399,090 | $35,598,099 | $10,199,009 | 40.2% |
| Laramie | $174,507,244 | $197,847,646 | $23,340,402 | 13.4% |
| Lincoln | $59,883,122 | $71,635,647 | $11,752,525 | 19.6% |
| Natrona | $101,683,704 | $122,637,105 | $20,953,401 | 20.6% |
| Niobrara | $10,454,059 | $11,420,317 | $966,258 | 9.2% |
| Park | $ 62,501,532 | $76,392,895 | $13,891,363 | 22.2% |
| Platte | $16,658,713 | $17,189,618 | $530,905 | 3.2% |
| Sheridan | $42,257,608 | $49,608,505 | $7,350,897 | 17.4% |
| Sublette | $155,861,031 | $237,969,967 | $82,108,936 | 52.7% |
| Sweetwater | $168,425,837 | $200,416,689 | $31,990,852 | 19.0% |
| Teton | $181,898,380 | $227,361,148 | $45,462,768 | 25.0% |
| Uinta | $28,190,561 | $33,828,142 | $5,637,581 | 20.0% |
| Washakie | $11,552,013 | $13,056,062 | $1,504,049 | 13.0% |
| Weston | $13,264,255 | $14,928,747 | $1,664,492 | 12.5% |
| Total | $1,728,301,129 | $ 2,199,769,606 | $471,468,477 | 27.3% |
Table 2 also notes how all but two (i.e., Niobrara and Platte) of the 24 counties’ total tax levies increased by more than 10%, and all but nine increased by 20% or more. There is a widespread unaffordability crisis of property taxes and other related living costs across the state. These property tax growth trends help tell the story of crushing local property taxes driven by excessive government spending at the local level. However, there must also be an accounting of how the state legislature handles the budget.
Recent State Budget Trends Show Unsustainable Spending
While tax revenue declines from 2013 to 2017 forced a decline in the state’s budget, substantial tax and spending increases occurred from 2018 to 2022. This recent period of high growth shows unsustainable spending, which must be reined in.
Figure 5 shows the state budget separated by revenue source (i.e., all funds, which includes state and federal funds) and state funds alone, compared to rates of population growth plus inflation (PGI) over the last decade from 2013 to 2022.
Figure 5. Wyoming’s Average Annual Growth for Budget Areas Per Period
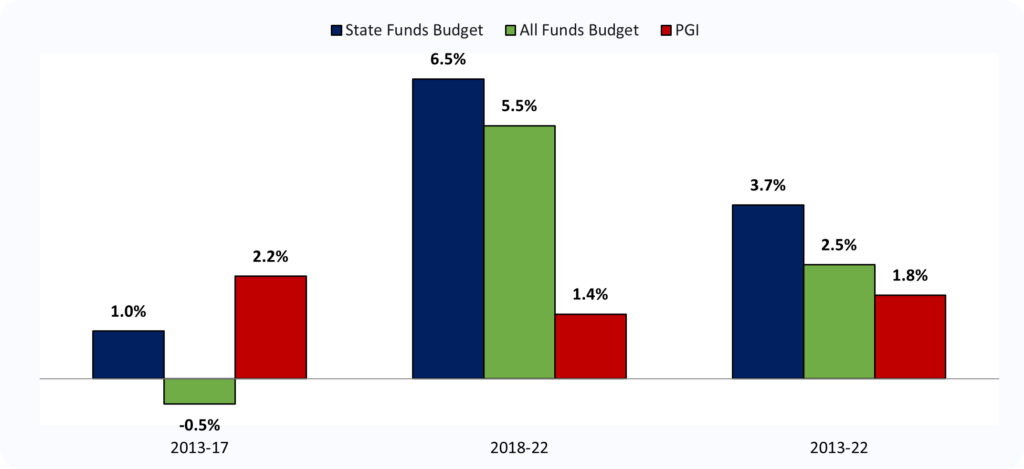
From 2013 to 2018, the state’s budget was well below the population growth rate plus inflation. However, as shown in Figure 5, spending growth in all funds and state funds has been well above this key rate in the last five years, leading to much faster budget growth rates than the PGI rate over the entire period. Restrained budgeting in the early years helped contain the damage at the time, but the state spending pace over the last five years has accelerated far above PGI. It cannot continue without higher taxes and less economic opportunity.
Recommendations to Reduce School Property Taxes and Fund Government
As outlined above, Wyoming’s state and local governments have a spending problem, not a revenue problem.[ix] Fortunately, our study demonstrates a way to reduce burdensome school property taxes without cutting spending or raising other taxes. Put simply, the state should impose spending discipline on itself and pass sustainable budgets based on the PGI cap.[x] Budget discipline at the state and local government levels is essential for Wyoming to be more competitive with other states and, most importantly, improve citizens’ quality of life and opportunities for jobs, wealth, and entrepreneurship.
Summary of this Bold Reform
State government must cap its spending growth by passing the PGI cap into law. Historical data analysis shows that savings from this cap will generate large state surpluses. These surpluses can then be used to fund school district budgets, reducing the school-funding portion of local property taxes annually and, over time, eliminating them.
Our analysis shows that with the spending discipline imposed by the PGI cap, this ‘buy-down’ plan conceivably can eliminate school property taxes statewide within ten years. Ninety percent of these continuing state surpluses would be used to reduce school property taxes. The remaining 10% of the state surplus would be available for unforeseen revenue shortfalls or other priorities and added to the following year’s budget.
“Relief valve” for schools
This plan holds the K-12 school expenditures from school property taxes constant (zero increase) yearly as the annual state surpluses are used to reduce local school-related property taxes. Increased funding will go to K-12 public schools automatically, based on Wyoming’s state school finance system, which this reform does not change. Simultaneously, school property taxes will continue to ratchet down as state surpluses (generated by the PGI cap) gradually reduce school property taxes to zero.
School property taxes today are 73% of all property taxes in Wyoming and are mostly controlled by the legislature through the state’s school finance formulas. We demonstrate that, with spending discipline, the legislature can gradually eliminate school property taxes without denying schools funding. The process of elimination won’t take too long but is entirely contingent on state government spending restraint from the PGI formula.
Immediate and Long-term Effects of This Bold Reform
The analysis in Table 3 below shows that school property taxes statewide would decline by 18% in year one. Continuing this approach annually would eliminate school property taxes by 2034. Other local governments (i.e., counties, municipalities, and special districts) should also spend less by adopting the PGI model, which each could eliminate their respective property taxes.
Our recommendation follows the limitation on state spending adopted in Colorado’s successful Taxpayer’s Bill of Rights (TABOR).[xi] TABOR imposes the PGI spending limit approach on state and local government spending. Local governments could impose this on themselves, or the state could pass a law or constitutional amendment extending the state’s PGI spending limit for all local governments. The PGI change would force counties, municipalities, and special districts to make necessary budget modifications or cuts and spend funds more wisely. The discipline of PGI caps introduces the risk of local voter disapproval of proposed tax increases. Local officials must weigh this risk against their plans, carefully considering whether taxpayers will continue to accept increasing property taxes.
The PGI model would result in surpluses at the local level. Just as at the state level, local tax revenues from sales taxes, fines, fees, and other revenue generally increase faster than this formula. The resulting surpluses would be returned to taxpayers by reducing their respective (non-school) property taxes until they are zero. Localities that do not generate surpluses or choose not to do so should still attempt to reduce their property taxes to compete with neighboring localities. Over time, a robust competitive process among communities would pressure them to eliminate their property taxes or otherwise find themselves left behind, stranded as high-cost economic islands with much higher taxes than their neighbors.
To provide for contingencies and specific new needs of local governments, the legislature must give localities other than school districts the option to seek new property tax revenue from their local taxpayers. The legislature should refrain from preempting the preference of local voters should a majority want higher property taxes to pay for specific projects and services.
However, the reform would impose a truth-in-taxation law requiring local governments to submit any increase in property taxes for voter (simple majority) approval in a uniform November election (i.e., no special elections outside the ordinary November date). This reform puts local taxation levels directly in the hands of local taxpayers.[xii] Only a transparent explanation and justification of each tax request by local governments (non-school) will lead to voter approval.
Codifying voters’ rights to approve or disapprove of their taxation represents a revolution in the current model. Budget transparency will be necessary to control debt issuance by local governments. The local voter approval requirement for new taxes will ensure that higher property taxes will not easily negate reductions in property taxes from PGI discipline to pay for servicing new debt without clear prior disclosure and transparent explanation to voters. Voters must be shown the new tax burden resulting from passing any proposition. Ballot language must be straightforward and disclose the cost for the average taxpayer. Taxpayers can be further protected by instituting caps on maximum debt issuance to control future tax hikes.
Example: This Reform is the Path to Zero for K-12 Education Property Taxes
These recommendations show a realistic, practical path for the state to eliminate school property taxes without affecting funding for K-12 public schools and for local governments to eliminate their property taxes. The proposal excludes the $6.4 million for bonds and interest, as those are tied up in financial contracts and may be costly to refinance. But this spending category is just 0.4% of the total $1.53 billion in collections from school property taxes in 2023. Thus, it could be paid off in full. To model outcomes, the innovative reform in this analysis carries forward the historical annual revenue data into the future. From 2017 to 2023, the data show an average annual growth rate of 7.6% in state general fund revenue and a 3.2% increase in the rate of population growth plus inflation. Thus, the PGI cap legislation would produce a 4.4% annual surplus in state general funds (7.6% less 3.2%). The law would specify holding back 10% of each year’s resulting surplus in a reserve to be added to the next year’s budget; the 90% remaining surplus funds in each subsequent year are paid to reduce school property taxes (see Table 3) until they are eliminated in 2034.
Once again, if unforeseen economic events lead to declines in general fund revenue or no surplus, then the state would not reduce school property taxes that year. The previous year’s reserve funds and sufficient spending restraint would be used to maintain past property tax cuts.
Year-by-Year Projections
The Table 3 projection shows that state general fund revenue starts at $1.43 billion in 2023 and then grows by its 2017 to 2023 historical average of 7.6% each year after that. State general fund spending would start at $1.19 billion in 2023 and then grow by the 2017 to 2023 historical annual average rate of population growth plus inflation of 3.2% every year.
In 2024, the results from these historical growth rates would be state revenue increasing by $108 million to $1.5 billion and spending increasing by $38 million to $1.2 billion, including any desired increase in funding for K-12 public education. This results in a surplus of $304 million. Under the reform, 90% of this surplus, or $273 million, is applied to fund the school finance system, reducing 2024 school property taxes from $1.5 billion to $1.2 billion and representing a permanent 18% school property tax cut. The state holds the remaining 10% of the surplus, $31 million, for 2025 tax revenue.
In 2025, state revenue will increase by $116 million to $1.7 billion, and state spending will increase by $39 million to $1.3 billion, including for K-12 public education. The difference between these two leaves a surplus of $411 million. However, the resulting surplus minus maintaining school funding ($273 million) from the prior year’s school property tax cuts is $137 million. Ninety percent of this remaining surplus is $124 million for additional school funding to reduce property taxes further from $1.2 billion to $1.1 billion (another 10% cut). The remaining 10% of the surplus is $13 million and is held to be added to state revenue in 2026.
From 2026 to 2034, this process will continue each period until school property taxes are eliminated in the final year. At that point, taxpayer dollars collected from state spending surpluses will pay 100% of school funding, and there will be no school property taxes in Wyoming.
Table 3. Example of Bold Reform with State General Fund Surplus if Started in 2024 (in Millions of Dollars)
| 2023 | 2024 | 2025 | 2026 | 2027 | 2028 | 2029 | 2030 | 2031 | 2032 | 2033 | 2034 | 2024-2034 | |
|---|---|---|---|---|---|---|---|---|---|---|---|---|---|
| 1. State Tax GF Revenue (Historical +7.6%) | 1,427 | 1,535 | 1,681 | 1,821 | 1,970 | 2,130 | 2,303 | 2,492 | 2,695 | 2,916 | 3,154 | 3,413 | 26,110 |
| 1a. Revenue Increases | – | 108 | 116 | 127 | 137 | 149 | 161 | 174 | 188 | 203 | 220 | 238 | 1,819 |
| 2. State GF Spending increases (Historical +3.2%) | 1,193 | 1,231 | 1,270 | 1,311 | 1,352 | 1,395 | 1,440 | 1,485 | 1,533 | 1,581 | 1,632 | 1,684 | 15,914 |
| 2a. Spending Increases from PGI | – | 38 | 39 | 40 | 42 | 43 | 44 | 46 | 47 | 49 | 50 | 52 | 491 |
| 3. State Available GF Surplus (1-2) | – | 304 | 137 | 114 | 118 | 129 | 142 | 156 | 172 | 189 | 207 | 227 | 1,895 |
| 3a. Cumulative Available Surplus | – | 304 | 441 | 555 | 673 | 802 | 944 | 1,100 | 1,272 | 1,461 | 1,668 | 1,895 | |
| 3b. Surplus for School District Funding (90% of Surplus) | – | 273 | 124 | 102 | 107 | 116 | 127 | 141 | 155 | 170 | 187 | 205 | 1,706 |
| 3c. Surplus Remaining for Next Year (10%) | – | 31 | 14 | 11 | 12 | 13 | 14 | 16 | 17 | 19 | 21 | 23 | 190 |
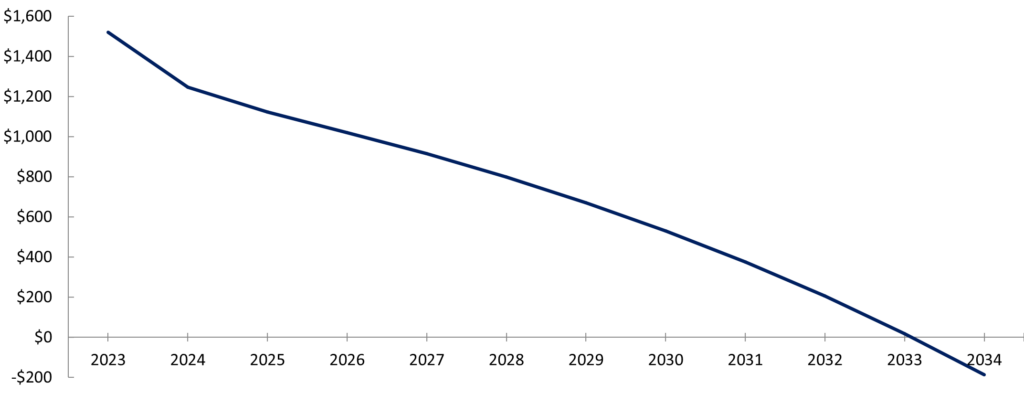
| 4. Local School District Property Taxes Paid | 1,521 | 1,247 | 1,124 | 1,021 | 915 | 798 | 671 | 530 | 375 | 205 | 19 | 0 | 6,720 |
| 4a. School District Property Tax % Cuts from 3b | – | -18% | -10% | -9% | -10% | -13% | -16% | -21% | -29% | -45% | -91% | -100% | |
| 5. Minimum Fixed School Funding (i.e., amount replaced over time by state surpluses) | 1,521 | 1,521 | 1,521 | 1,521 | 1,521 | 1,521 | 1,521 | 1,521 | 1,521 | 1,521 | 1,521 | 1,521 | 16,726 |
| 5a. Total School Funding Available, excluding amount already funded by the state (projected after increases from PGI formula (see 2a) | – | 1,559 | 1,560 | 1,561 | 1,562 | 1,564 | 1,565 | 1,566 | 1,568 | 1,569 | 1,571 | 1,572 | 17,217 |
Figure 6 illustrates what this bold reform would look like for annual school property tax reductions until those taxes are eliminated in 2034.
Figure 6. Path to Zero for K-12 School Property Taxes Given Bold Reform, Millions of $
K-12 public school funding would suffer no cuts since the state budget increases annually by the PGI rate. The increases would help cover any increase in the K-12 public education funding due to the state’s school finance formulas or other priorities determined by the legislature with a simple majority vote. However, the spending discipline imposed by the PGI formula generates surpluses, eventually leading to the state paying entirely for K-12 public education without property taxes.
The only local property taxes remaining for schools would be to pay off bond principal and interest. In prosperous years with growing state surpluses, the state could also pay off the bonds, hastening the process of eliminating all school property taxes. If state general fund revenue grows faster and spending grows slower than the assumptions here, school property taxes can be eliminated faster. Or, if general revenue grows slower or spending grows faster than these assumptions, school property taxes would still be eliminated but over a longer period.
The essential concept of these reforms is to create a mechanism for spending discipline to lead to surpluses that are returned to taxpayers by reducing school property taxes and not changing the formula funding for K-12 public education.
As previously explained, other local governments have the means to generate higher tax revenues for their needs, provided they make their case to taxpayers who must approve any increases. If there is an unforeseen state revenue shortfall from a reduction in fossil fuel prices, extraction volumes, or other causes, the formulas in the legislation automatically allocate the remaining surplus from the previous year to the state’s current year budget, cushioning the impact of the shortfall. Other reserves might also be available to cover revenue declines.
To repeat a critical point, there are no additional school property tax reductions if there is no surplus. As noted above, another feature of this reform proposal recommends that other local governments adopt this or a similar approach and limit their spending growth to a rate no higher than the PGI formula. The resulting surpluses should eventually eliminate their respective property taxes – a process that might take longer than it does for the state to eliminate school property taxes. The big benefit would be the change in expectations for families and businesses, who would no longer dread their next property tax bill.
Brief Summary of Bold Reform
- To consistently restrain government spending, this bold reform proposal recommends that the Wyoming Legislature pass a strong state spending limit that better matches the financial capacity of the average taxpayer’s ability to pay.[xiii] The PGI spending limit should cover as much of the state budget as possible and allow a two-thirds majority vote of each legislature chamber to exceed it.
- Knowing the annual data can be volatile, using a PGI formula of the average rate of population growth plus inflation over the prior three years may be a better approach than a one-year calculation. However, bear in mind that any increase in the spending rate above the rate of population growth plus inflation results in an increase in real state government spending per person.
- Regardless of whether an increase in spending is financed by higher taxes, fees, or debt, more state spending unquestionably increases the economic burden of taxes on people in Wyoming and should be avoided. The state should also consider passing a law requiring local governments to adopt the state PGI spending limit.
- The state should also pass a truth-in-taxation law requiring that local voters approve any property tax increases in a uniform November election.
Conclusion
Property taxes are an exceptional burden in Wyoming. The time for drastic reform has arrived. Enough damage has been done to Wyoming’s citizens and businesses. Too many opportunities for people to flourish have been squandered. Reform begins by limiting government spending at the state and local levels. The resulting surpluses will benefit taxpayers directly!
There are many reasons for the rising spending increases, especially in K-12 public education and health care. While these may be priorities for voters and lawmakers, this reform gives voters a direct choice between paying higher local property taxes, which they vote to impose on themselves or relieving the personal (and business) cost to their finances from these taxes. In other words, taxation with the consent of the governed!
A fundamental truth is that property taxes are wealth taxes, which keep people from owning their homes or other properties. Today, property taxes force people to pay their government the equivalent of rent in perpetuity. Our bold reform ends the current flawed, deficient model. Enacting this reform would make Wyoming an economic juggernaut. Most importantly, it would assure citizens their God-given right to own property. It is time to stop renting from the government and start owning a home or property without the threat of confiscation or bankruptcy.
Appendix
Table A compares Wyoming with several other states. The states are ordered according to the Fraser Institute’s economic freedom ranking, from highest on the left to lowest on the right.
Table A. Ranking and Value of Key Comparisons for Wyoming with Neighboring and Other States
| Measure | U.S. | South Dakota | Texas | Idaho | Utah | Nebraska | Montana | Wyoming | Colorado | California |
|---|---|---|---|---|---|---|---|---|---|---|
| Economic Freedom of North America Index (2021)[xiv] | 5th(World) | 5th 7.59 | 4th 7.64 | 7th 7.31 | 16th 6.67 | 13th 6.85 | 22nd 6.55 | 18th 6.63 | 21st 6.60 | 48th 4.27 |
| State Migration Trends, Net Migration (2022)[xv] | — | 5th 1.5% | 4th 1.6% | 2nd 1.8% | 10th 1.2% | 24th 0.2% | 6th 1.5% | 21st 0.3% | 19th 0.5% | 41st -0.3% |
| State Business Tax Climate Index (2024)[xvi] | — | 2nd 7.46 | 13th 5.48 | 16th 5.40 | 8th 5.62 | 30th 5.01 | 5th 6.02 | 1st 7.72 | 27th 5.09 | 48th 3.64 |
| State Economic Outlook (2023)[xvii] | — | 14th | 13th | 4th | 1st | 36th | 33rd | 6th | 25th | 45th |
| State & Local Spending Per Capita (2022)[xviii] | $12,923 | 44th $10,609 | 37th $11,507 | 49th $9,635 | 25th $12,557 | 18th $14,258 | 32nd $12,084 | 3rd $19,235 | 13th $14,258 | 4th $18,760 |
| S&L Spending on K-12 Education Share of Income & Per Pupil (2023)[xix] | 3.6% $16,080 | 3.0% $13,034 | 3.9% $13,684 | 2.5% $8,748 | 3.2% $9,479 | 4.3% $16,642 | 3.4% $15,035 | 4.4% $19,887 | 3.0% $15,231 | 3.2% $16,285 |
| S&L Property Tax Collections Per Capita (2020)[xx] | $1,810 | 26th $1,606 | 11th $2,216 | 39th $1,131 | 34th $1,209 | 13th $2,088 | 18th $1,806 | 12th $2,163 | 14th $1,956 | 15th $1,955 |
| Composite Cost of Living Index (2023:Q3)[xxi] | 100 | 16th 91.8 | 18th 93.0 | 28th 99.0 | 34th 104.5 | 12th 91.0 | 33rd 103.1 | 19th 93.2 | 35th 106.9 | 48th 136.4 |
| State Economic Performance (2011-21)[xxii] | — | 16th | 7th | 4th | 2nd | 25th | 14th | 43rd | 5th | 18th |
| Avg. U-3 Unemployment Rate (2003-22)[xxiii] | 6.0% | 3.4% | 5.6% | 4.9% | 4.2% | 3.5% | 4.7% | 4.5% | 5.3% | 7.3% |
| Avg. Labor Force Participation Rate (2003-22)[xxiv] | 64.0% | 70.7% | 65.2% | 65.4% | 69.2% | 71.4% | 64.6% | 68.4% | 69.7% | 63.5% |
| Avg. Annual Nonfarm Payroll Growth (2003-22)[xxv] | 0.8% | 0.9% | 1.8% | 1.9% | 2.3% | 0.6% | 1.3% | 0.7% | 1.4% | 1.0% |
| Official Poverty Rate (2020-22)[xxvi] | 11.5% | 9.7% | 13.7% | 8.9% | 7.1% | 8.1% | 10.7% | 8.7% | 8.5% | 11.4% |
| Supplemental Poverty Rate (2020-22)[xxvii] | 9.8% | 5.8% | 12.3% | 5.7% | 5.7% | 5.9% | 8.5% | 7.2% | 8.9% | 13.2% |
Two of these states are the largest in the country in terms of population and economic output: California and Texas.[xxviii] Like Wyoming, two states do not have a personal income tax: South Dakota and Texas.[xxix] California has the nation’s highest marginal personal income tax rate.[xxx]There are also regionally neighboring states of South Dakota, Idaho, Utah, Nebraska, Montana, and Colorado. While Wyoming ranks as the best state for business tax climate, the state and local spending per capita is the third highest in the country. Wyoming’s property tax collections per capita rank 12th worst in the country, with the highest amount among neighboring states. These exorbitant costs to taxpayers put pressure on businesses and people to choose other places to locate elsewhere. The data show that states with less economic freedom (e.g., California, Colorado, and Wyoming) tend to perform economically worse. On the other hand, those states with more economic freedom (e.g., South Dakota, Texas, Idaho, and Utah) tend to perform economically better. Given these comparisons, there is much room for improvement in Wyoming to be more competitive and, more importantly, provide more opportunities for human flourishing.
i https://fred.stlouisfed.org/series/WYPCPI
ii https://www.statista.com/statistics/248053/us-real-gross-domestic-product-gdp-by-state/
iii https://www.statista.com/statistics/248063/per-capita-us-real-gross-domestic-product-gdp-by-state/
v https://www.statista.com/statistics/233170/median-household-income-in-the-united-states-by-state/
vi https://www.fraserinstitute.org/sites/default/files/economic-freedom-of-north-america-2023.pdf
vii https://drive.google.com/file/d/1WsXL6JJ0MvGu77Jq-z3YVytVX8JeXM62/view
viii https://drive.google.com/file/d/1WsXL6JJ0MvGu77Jq-z3YVytVX8JeXM62/view
ix https://www.atr.org/budgetproject/
xi https://tax.colorado.gov/TABOR
xii https://alec.org/model-policy/truth-in-taxation-act/
xiii https://www.vanceginn.com/letpeopleprosper/responsible-state-budgets-across-the-us
xiv https://www.fraserinstitute.org/sites/default/files/economic-freedom-of-north-america-2023.pdf
xv https://taxfoundation.org/state-population-change-2022/
xvi https://taxfoundation.org/research/all/state/2024-state-business-tax-climate-index/
xvii https://www.richstatespoorstates.org/publication/rich-states-poor-states-16th-edition/
xviii https://www.usgovernmentspending.com/state_spending_rank_2022dF0c
xix https://educationdata.org/public-education-spending-statistics
xx https://taxfoundation.org/publications/facts-and-figures/
xxi https://meric.mo.gov/data/cost-living-data-series
xxii https://www.richstatespoorstates.org/app/uploads/2023/04/2023-16th-RSPS.pdf
xxiii https://www.bls.gov/lau/ex14tables.htm
xxiv https://www.bls.gov/lau/ex14tables.htm
xxv https://www.bls.gov/lau/ex14tables.htm
xxvi https://www.census.gov/content/dam/Census/library/publications/2023/demo/p60-280.pdf
xxvii https://www.census.gov/content/dam/Census/library/publications/2023/demo/p60-280.pdf
xxviii https://worldpopulationreview.com/states
xxix https://taxfoundation.org/publications/state-individual-income-tax-rates-and-brackets/ [1]
xxx https://taxfoundation.org/publications/state-individual-income-tax-rates-and-brackets/
Texans for Fiscal Responsibility relies on the support of private donors across the Lone Star State in order to promote fiscal responsibility and pro-taxpayer government in Texas. Please consider supporting our efforts! Thank you!
Get The Fiscal Note, our free weekly roll-up on all the current events that could impact your wallet. Subscribe today!