
One of the most persistent lies in Texas politics is that Texas schools are “underfunded.”1
This lie takes many different forms. We’ll examine some of those below.
First, though, let’s take a look at the growth in Texas spending on public schools over the last decade.
| Figure 1. 10-Year Growth in Expenditures on Texas Public Schools | |||||
| School Year | Total Expenditures | % Change | Per Pupil | % Change | Per Pupil Adj |
| 2015-16 | $64,061,068,212 | 6.08% | $12,130 | 4.66% | $12,130 |
| 2016-17 | $67,475,719,295 | 5.33% | $12,631 | 4.13% | $12,355 |
| 2017-18 | $69,252,688,668 | 2.63% | $12,861 | 1.82% | $12,300 |
| 2018-19 | $70,993,369,584 | 2.51% | $13,108 | 1.92% | $12,325 |
| 2019-20 | $77,019,760,233 | 8.49% | $14,058 | 7.25% | $13,040 |
| 2020-21 | $79,294,505,532 | 2.95% | $14,797 | 5.26% | $13,023 |
| 2021-22 | $84,854,165,916 | 7.01% | $15,705 | 6.14% | $12,775 |
| 2022-23 | $92,414,047,078 | 8.91% | $16,792 | 6.92% | $13,171 |
| 2023-24 | $99,988,017,629 | 8.20% | $18,125 | 7.94% | $13,878 |
| 2024-25* | $103,381,139,116 | 3.39% | $18,693 | 3.13% | $13,895 |
| Avg. Increase | $4,299,443,676 | 5.55% | $710 | 4.90% | |
| Total Increase | $42,994,436,766 | 80.58% | $7,103 | 61.29% | |
Figure 1 shows that total spending on Texas public schools has increased by $43 billion over the last decade, an 81% increase. This accounts for local funding through property taxes, state funding (including recaptured property taxes), and federal funding. On average, Texas taxpayers have funded a 5.6% annual increase in spending through local, state, and federal taxes over this period. This is close to double the 3% average annual growth of Texans’ personal income.
The truth of the matter is that compared to public schools, it is Texas taxpayers who are “underfunded.” Texas politicians fail to either understand or acknowledge this. For instance, this past spring the Texas Legislature increased funding for public schools by $13.1 billion over the next two years (Legislative Budget Board, 216).4
Digging into the Lie
One form the “underfunded” lie above takes is that “per student [needs] to recover from inflationary losses suffered since the last meaningful increase in public education funding in 2019” (Texas State Teachers Association). Actually, there are two lies here. The first one is that there have not been any meaningful increases in school funding since 2019. As Figure 1 shows, Texas school funding has increased by $27 billion since 2019; that would seem a meaningful increase to most observers.
The second lie from the TSTA is that current funding is below 2019 levels when adjusted for inflation. Let’s ignore for this purpose that the need for inflation adjusted government funding is a fraud perpetrated on taxpayers; Texans’ incomes are not inflation adjusted, so why should funding for the government be adjusted—especially when the (federal) government is responsible for inflation? The last column in Figure 1 shows that per-student inflation-adjusted funding for Texas public schools was $13,040 in 2019. Today it is $13,895, an increase of $891. Public school funding has increased significantly, no matter how it is measured.
The Texas Legislature’s Complicity
Sadly, the Texas Legislature is complicit in maintaining the lie. Its Legislative Budget Board, controlled by Texas’ lieutenant governor and speaker of the Texas House, recently published the table below. It shows that the Texas Education Agency’s funding for public schools, seen in the “Total Adjusted Dollars” column, has declined from $55.2 billion in 2019 to $48.9 billion in 2025 (Legislative Budget Board, 218).5 This makes it appear that education funding in “real” or 2019 dollars has dropped. However, as shown in Figure 1, the opposite is true. Why the discrepancy?
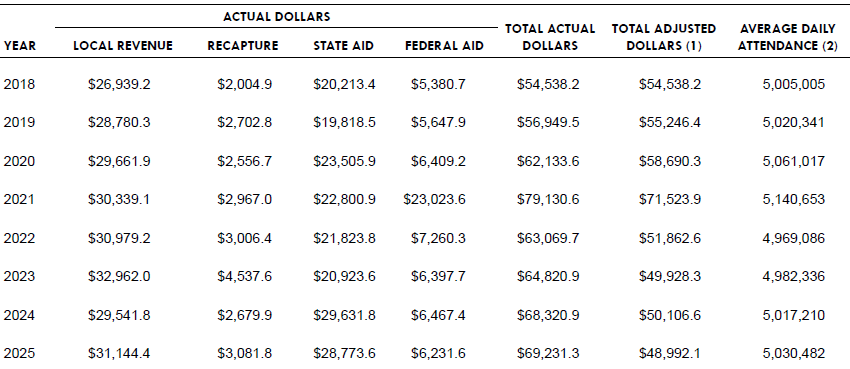
There are two reasons. First, the LBB figures do not show the 2024-25 $103.4 billion total expenditure for Texas public schools estimated from the TEA data. Instead, it only shows $69.2 billion in “Texas Education Funding” for “pre-k to grade 12.” The LBB’s way of reporting the data may be legitimate, but it does not show a complete picture of public education funding.
The second reason, how the LBB “adjusts” the funding, is the most problematic. A footnote to the LBB’s table notes that, “Adjusted dollars are calculated with compounded state population and inflation growth.” While population growth may be an appropriate adjustment for some state spending, it is completely misleading to use it for determining changes in education spending? Why? Because school spending is based on the number of students in the classroom. Why, then, would the LBB use population growth?
This author cannot read the minds of those responsible for publishing the Fiscal Size-up. However, the most obvious reason is to make it appear as if adjusted public education funding was decreasing. Though Texas’ population increased by about 9.5% from 2019 to 2025, the average number of students in Texas schools increased by only 2.02% (see the Average Daily Attendance figures in the LBB’s chart above). Using the population growth figures greatly distorts the LBB’s adjusted dollars.
It does, however, provide groups like the Texas State Teachers Association ammunition to falsely claim funding for Texas schools has declined.
Conclusion
Public education expenditures are one of the largest items in the Texas budget. The significant increase in public education spending shown in this paper—both in current and real dollars—is one of the primary drivers of increased spending6 at the state level and property tax increases 7at the local level. Texans who want lower state and local taxes should let Texas politicians know they must work to stop the runaway growth of spending on public schools.
This is the third paper in the series examining the growth of Texas government over the last decade.
Texans for Fiscal Responsibility relies on the support of private donors across the Lone Star State in order to promote fiscal responsibility and pro-taxpayer government in Texas. Please consider supporting our efforts! Thank you!
Get The Fiscal Note, our free weekly roll-up on all the current events that could impact your wallet. Subscribe today!
- https://tsta.org/grading-texas/even-with-an-extra-8-5-billion-for-public-schools-texas-still-trails-the-national-average-in-per-student-funding-by-4000/#:~:text=There%20was%20a%20lot%20of,Utah%20spent%20less%20per%20child. ↩︎
- https://tea.texas.gov/finance-and-grants/state-funding/state-funding-reports-and-data/peims-financial-standard-reports ↩︎
- https://data.bls.gov/cgi-bin/cpicalc.pl?cost1=100.00&year1=201609&year2=202509 ↩︎
- https://www.lbb.texas.gov/Documents/Publications/Fiscal_SizeUp/9046_Fiscal_Size-up_26-27_Biennium.pdf ↩︎
- https://www.lbb.texas.gov/Documents/Publications/Fiscal_SizeUp/9046_Fiscal_Size-up_26-27_Biennium.pdf ↩︎
- https://texastaxpayers.com/a-decade-of-government-growth-legislative-appropriations/ ↩︎
- https://texastaxpayers.com/a-decade-of-government-growth-property-taxes/ ↩︎