Overview
- Texans for Fiscal Responsibility proposed the Frozen Texas Budget, which would keep the state’s budget from growing. The budget is already too big, thereby excessively burdening taxpayers.
- TFR also provided a three-step process to eliminate all property taxes over the next decade by simply limiting government spending at the state and local levels of government and returning surplus collected taxpayer dollars to taxpayers.
- But the 88th Texas Legislature chose to pass the largest budget increase in Texas history, thereby leaving less available for property tax relief, which is the major tax burden felt by Texans across the state.
- The Texas Legislature must practice more budget restraint in order to sustain the second-largest tax relief package this year, or the result will be higher taxes or massive spending cuts. This spending restraint must also happen at the local level so taxes can be reduced and property taxes can ultimately be eliminated, allowing Texans to achieve their right to own property.
Texas Passes Largest Budget Increase in Texas History
Texas Governor Greg Abbott (R) recently signed the Texas budget (HB 1) passed by the 88th Texas Legislature with the largest spending increases, the largest corporate welfare increases, and the largest social safety net increases—without the largest property tax cuts—in Texas history.
State officials can claim that the budget increases by less than the rate population growth and inflation using the data in Table 1 by the Legislative Budget Board.
Table 1
Legislative Budget Board’s Comparison for the Texas Budget
| Source of Appropriations (in millions) | 2022-23 Appropriations | 2024-25 Appropriations | 2024-25 Budget Change | 2024-25 Budget % Change |
|---|---|---|---|---|
| General Revenue Funds | $130,403.6 | $144,130.4 | $13,726.8 | 10.5% |
| General Revenue Dedicated Funds | $8,024.2 | $6,833.7 | ($1,190.5) | -14.8% |
| General Revenue-Related Funds | $138,427.8 | $150,964.1 | $12,536.3 | 9.1% |
| Other Funds | $47,567.1 | $68,087.2 | $20,520.1 | 43.1% |
| State Funds Total | $185,994.9 | $219,051.3 | $33,056.4 | 17.8% |
| Federal Funds | $117,301.4 | $102,286.3 | ($15,015.1) | -12.8% |
| All Funds Total | $303,296.3 | $321,337.6 | $18,041.3 | 5.9% |
But those calculations use fuzzy math, as they’re based on inflating the 2022-23 base budget of general revenue not dedicated by the Constitution and consolidated general revenue with more spending, then increasing it by the rate of population growth times inflation of 12.33% (determined by the average of population growth times inflation over the last two years and the upcoming two years). Compare this with 2024-25 appropriations, which will be higher later when the supplemental bill passes. These calculations are then spending-to-appropriations, which is like comparing apples with oranges.
Even with these calculations, the Legislative Budget Board shows in Table 2 that there is $10.7 billion in tax revenue remaining, $1.6 billion available under the constitutional spending limit using general revenue not dedicated by the Constitution, and $11.8 billion available under the 2021 spending limit with consolidate general revenue using general revenue and dedicated general revenue.
Table 2
Remaining General Revenue UInder Different State Limits
Remaining General Revenue (GR)
Spending Authority, 2024-25
| based on HB 1 & SB 30 Appropriations | (in billions) |
| Pay-as-you-go Limit Texas Constitution, Article III, Section 49a | $10.7 |
| Tax Spending Limit Texas Constitution, Article VIII, Section 22 Texas Gov’t Code, Section 316.001(b) | $1.6 |
| Consolidated GR Limit Texas Gov’t Code, Section 316.001(c) | $11.8 |
While the data in Table 1 provides an apples-to-apples budget comparison, the charts below are more accurate ways to evaluate the budget growth from an appropriations-to-appropriations approach.
Better Comparisons for Budget Growth
Understanding that any growth in the budget means an expansion of government, there are two strong arguments for limiting government spending:
1) Table 3 shows data for freezing the budget in inflation-adjusted per capita terms using the rate of population growth plus inflation (i.e., Conservative Texas Budget and responsible budget approach in other states), which was 16% over the last two fiscal years. This approach is appropriate as it grows slower than the economy over time. It also excludes $13.3 billion in COVID-related funding in the first biennium as well as new and old tax relief amounts of $6.2 billion ($100 million in new relief) in the first period and $18 billion (i.e., amounts passed in HB 1 of $5.2 billion for old relief and the latest of $12.7 billion in new relief during the second special session). Excluding these helps to not include one-time federal funding and amounts that don’t grow government.
Table 3
Texas Budget Compared with Conservative Texas Budget
| HB 1 (in millions) | 2022-23 Appropriations | 2024-25 Appropriations | Difference | 2024-25 Conservative Texas Budget (Pop+Inf) | 2024-25 Budget v. CTB |
|---|---|---|---|---|---|
| GR | $112,954.1 | $126,130.4 | $13,176.3 | $112,954.1 | $13,176.3 |
| GR-D | $6,319.9 | $6,833.6 | $513.7 | ||
| GRR | $119,274.0 | $132,964.0 | $13,690.9 | ||
| Other | $40,799.1 | $68,087.3 | $27,288.2 | ||
| State Total | $160,073.1 | $201,051.3 | $40,978.2 | $185,628.7 | $15,422.6 |
| Federal | $85,216.7 | $102,286.3 | $17,069.6 | ||
| All Funds Total | $245,289.8 | $303,337.6 | $58.047.8 | $284,450.2 | $18,887.4 |
| GR Change | 11.7% | ||||
| GRR Change | 11.5% | ||||
| State Change | 25.6% | 16.0% | |||
| Fed Change | 20.0% | ||||
| All Change | 23.7% | 16.0% |
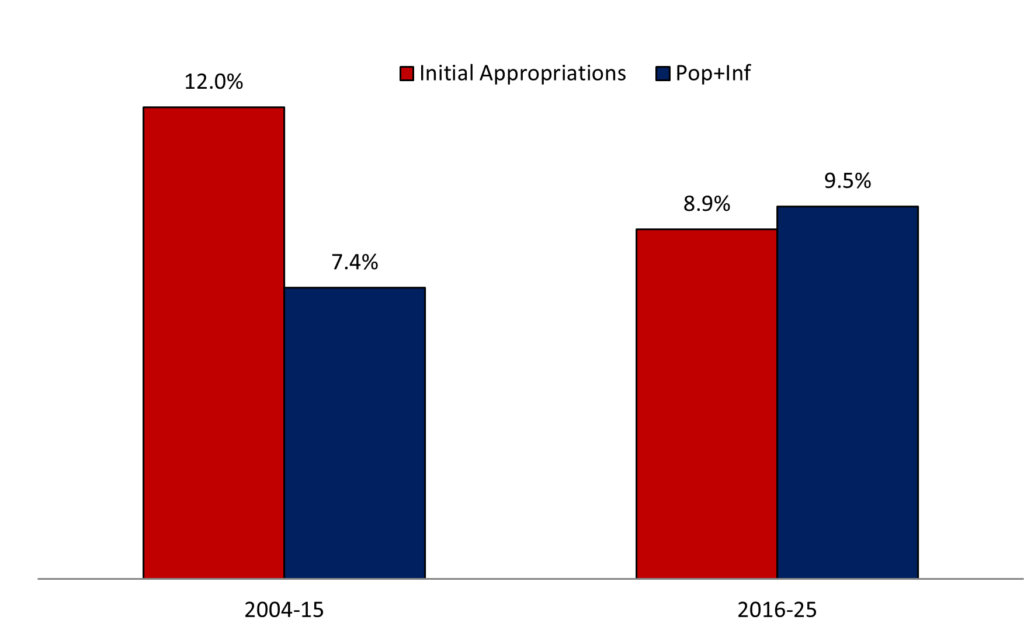
Using the CTB approach above, Table 4 highlights how the budget has improved since implementation of the CTB started with the 2016-17 budget. This looked much better before the current 2024-25 budget, but the massive growth of the current budget raised the growth of initial appropriations even as the rate of population growth plus inflation rose slightly during the latter five-budget period. If the growth of the budget is not controlled, it will soon surpass the rate of population growth plus inflation like it did during the prior six budget periods.
Table 4
Texas’ All Funds Biennial Budget Growth Improves Since 2016 But Needs Improvement

2) Table 5 shows freezing the budget with zero growth as the budget is already too big (i.e., Frozen Budget), including COVID-related funds in the first period and new and old property tax relief amounts in both periods.
Table 5
Texas Budget Compared with Frozen Texas Budget
| HB 1 (in millions) | 2022-23 Appropriations | 2024-25 Appropriations | Difference | 2024-25 Frozen Budget (0% Change) | 2024-25 Budget v. Frozen |
|---|---|---|---|---|---|
| GR | $119,154.1 | $144,130.4 | $24,976.3 | $119,154.1 | $24,976.3 |
| GR-D | $6,319.9 | $6,833.6 | $513.7 | ||
| GRR | $125,474.0 | $150,964.0 | $25,490.0 | $125,474.0 | $25,490.0 |
| Other | $40,799.1 | $68,087.3 | $27,288.2 | ||
| State Total | $166,273.1 | $219,051.3 | $52,778.2 | $166,273.1 | $52,788.2 |
| Federal | $98,531.6 | $102,286.3 | $3,754.7 | ||
| All Funds Total | $264,804.7 | $321,337.6 | $56,532.9 | $264,804.7 | $56,532.9 |
| GR Change | 21.0% | ||||
| GRR Change | 20.3% | ||||
| State Change | 31.7% | 0.0% | |||
| Fed Change | 3.8% | ||||
| All Change | 21.3% | 0.0% |
Conclusion
Both approaches show that while the general revenue related (GRR) funds amount is below the rate of population growth and inflation (either plus or times) for the CTB approach, the broader measures of state funds and all funds that better represent the burden of government spending on taxpayers are well above either metric. And when using the frozen Texas budget approach, the only budget amount below either rate of population growth and inflation is federal funds.
In other words, the Legislature is using fuzzy math when it comes to the budget and property tax relief. This looks much more like what would be done in California rather than Texas. This is not what Texans want or expect from their elected officials. If this continues, Texas will be California soon. While this is the largest spending increase in Texas history, there was also at least $10 billion in new corporate welfare—the largest in state history.
Texas must not sit back on its laurels while ending this populist trend. Texas must do what’s in the best interest for everyone, which is limiting or cutting government spending, taxes, and regulations so there’s more freedom for people to prosper. A better path would have been to spend less and put Texas on a path to eliminate property taxes so Texans can have the right to own their property instead of perpetually renting from the government. By following the Texans for Fiscal Responsibility’s three-step process of passing a frozen state budget, using 90% of surplus dollars to compress school district M&O property tax rates until they are zero, and having local governments eliminate the rest of their property taxes with surplus dollars above a new local spending limit, Texas can eliminate property taxes soon. There’s a chance to do so during a special session during the interim or next session.
Texans for Fiscal Responsibility relies on the support of private donors across the Lone Star State in order to promote fiscal responsibility and pro-taxpayer government in Texas. Please consider supporting our efforts! Thank you!
Get The Fiscal Note, our free weekly roll-up on all the current events that could impact your wallet. Subscribe today!


