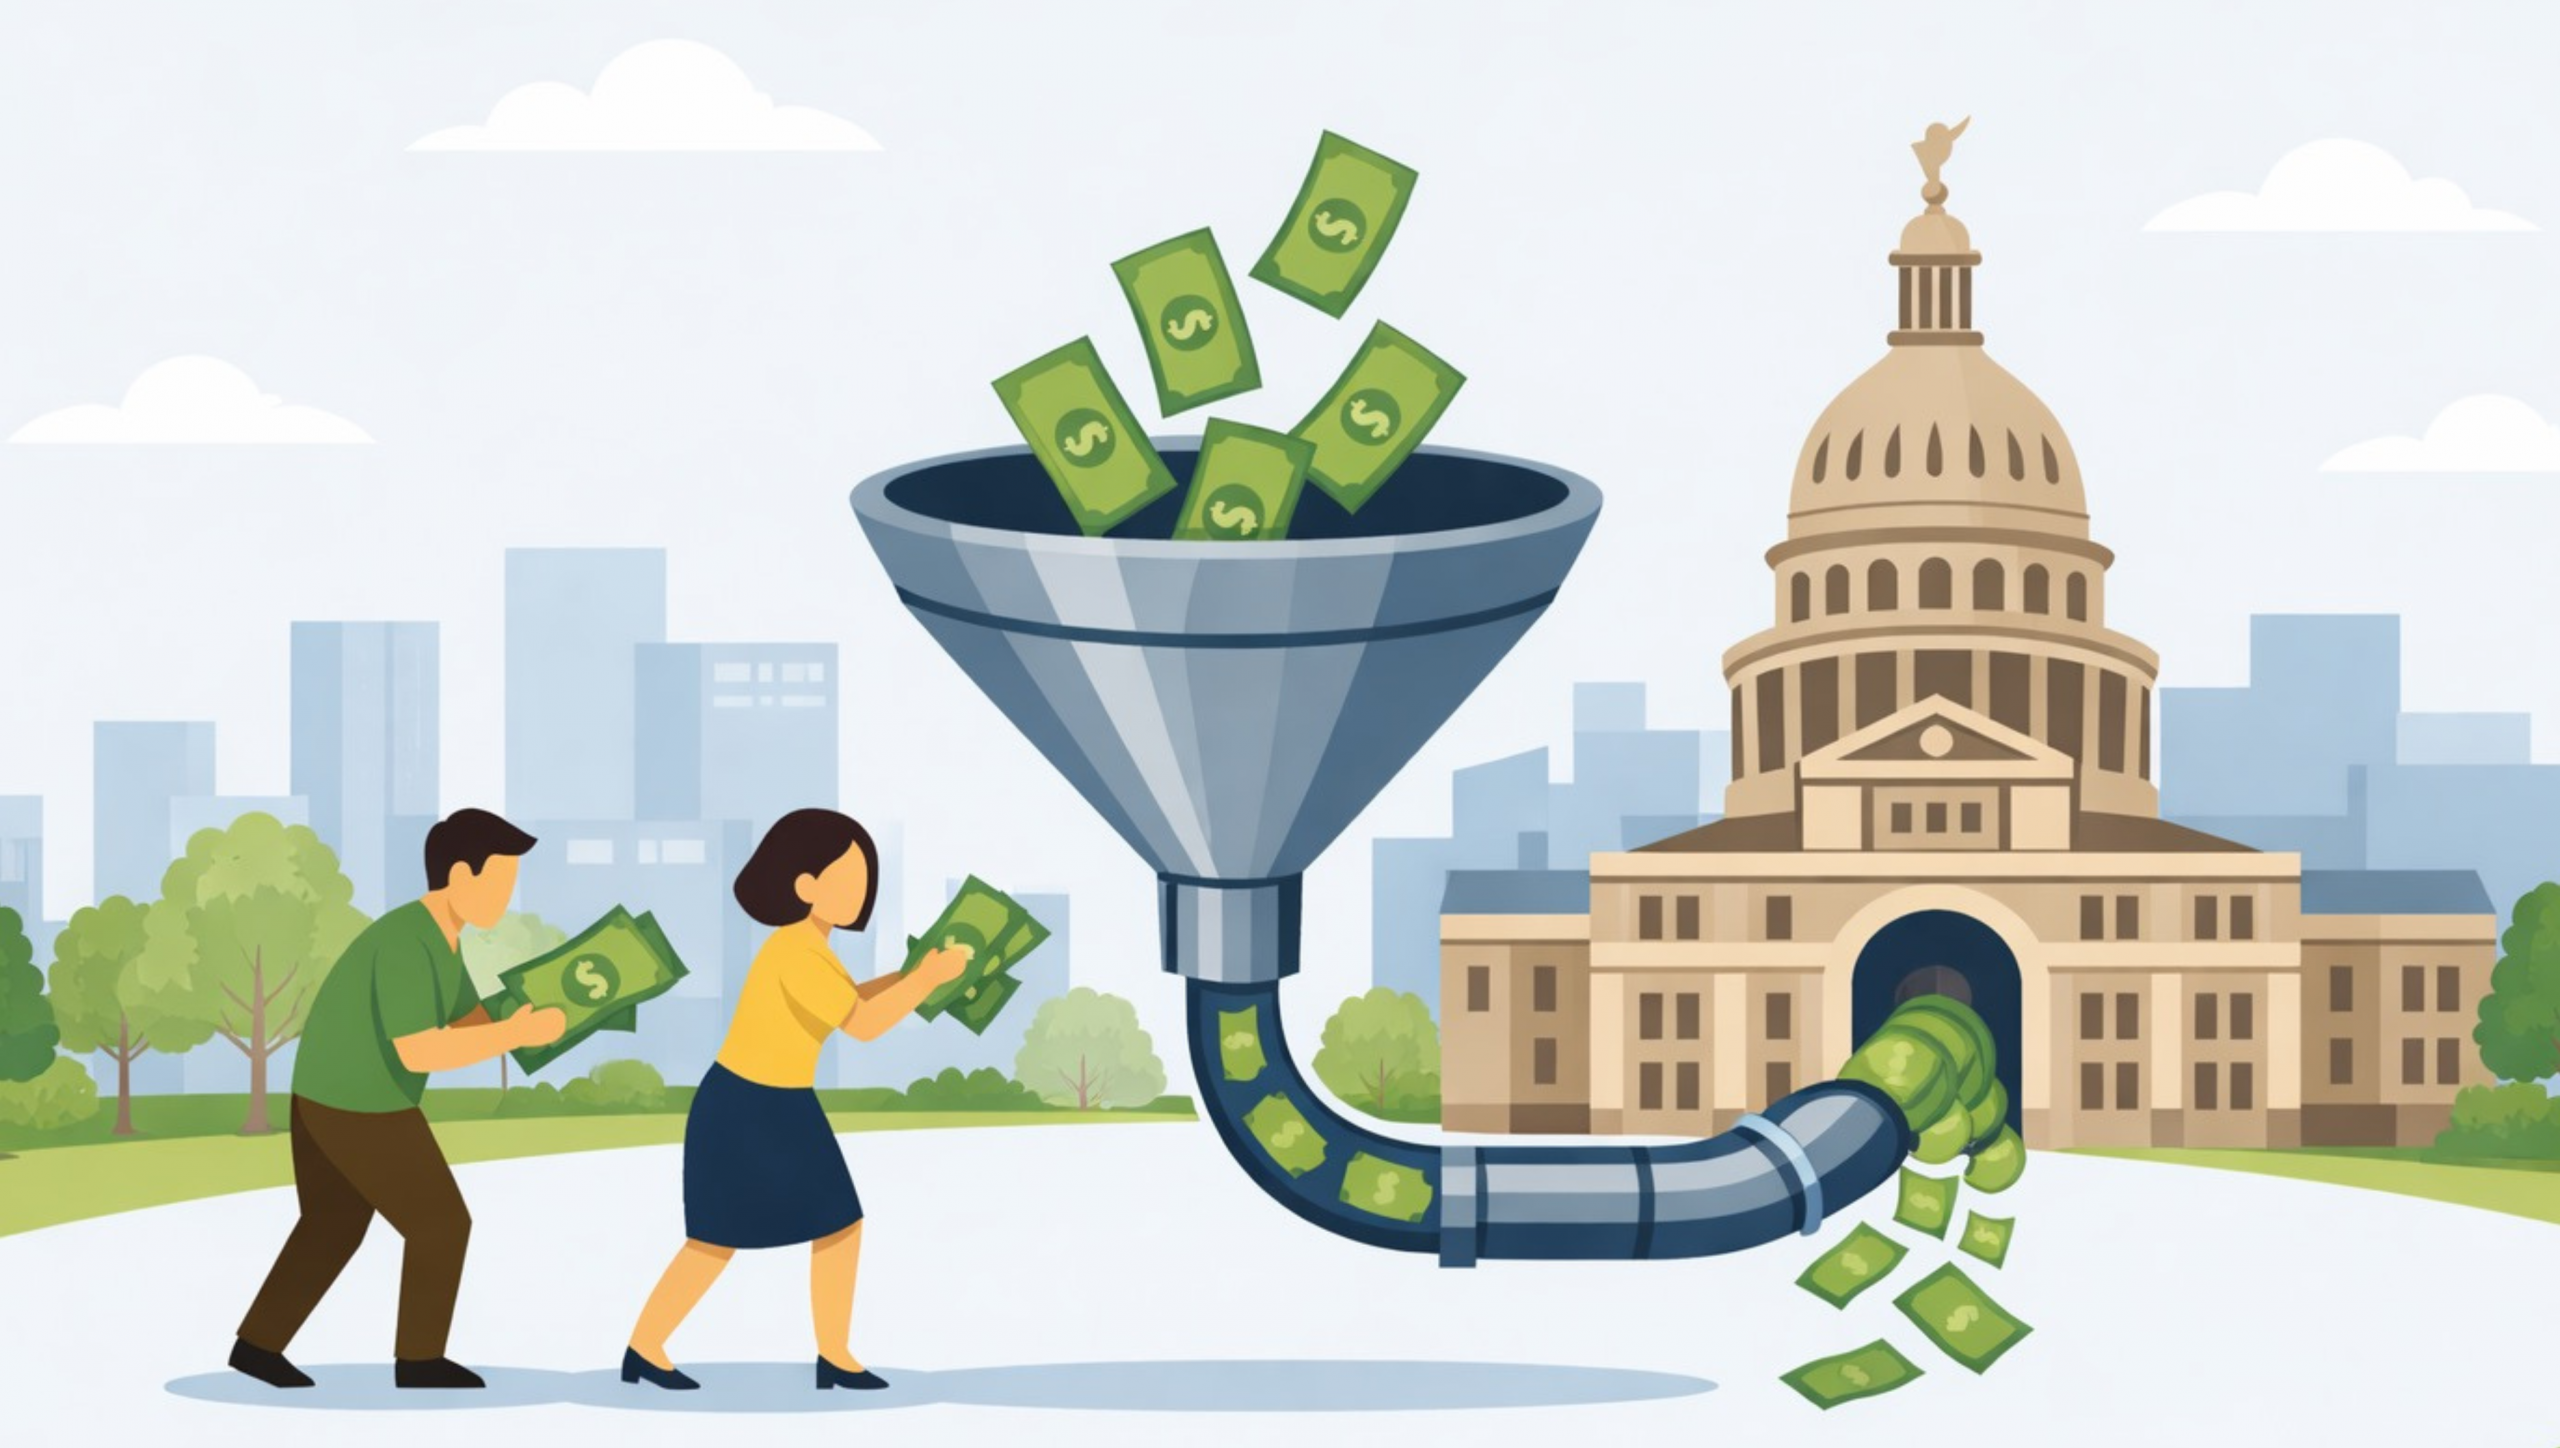
The old truism is that there are two certainties in life, death and taxes. I’d like to modify that slightly to death and government spending.
After all, government spending is why taxes exist. No spending, no taxes. But there is spending, and a lot of it. In fact, government—including Texas government—spends just about every tax dollar it can get its hands on.
| Figure 1: Session Appropriation of States Funds (in billions) | ||||||
| Year | 2013 | 2015 | 2017 | 2019 | 2021 | 2023 |
| Amount | $132.1 | $141.1 | $144.7 | $169.5 | $162.3 | $228.1 |
| Growth | 16.64% | 6.75% | 2.57% | 17.17% | -4.29% | 40.5% |
Figure 1 shows the increases of the Texas Legislature’s appropriations of state funds each session since 2013. Notice the wild swings in how much spending growth the Texas Legislature authorizes each session. Why is that? Because they spend almost all the money available to them. When members have a lot of money they spend it. When they don’t, they don’t.
| Figure 2: Session Appropriation of All Funds (in billions) | ||||||
| Year | 2013 | 2015 | 2017 | 2019 | 2021 | 2023 |
| Amount | $207.5 | $209.3 | $218.1 | $258.1 | $281.9 | $334.9 |
| Growth | 23.55% | 0.87% | 4.21% | 18.33% | 9.21% | 18.8% |
When we look at all spending in Figure 2, including federal funds, we see the same pattern. The main difference is that the state usually uses federal funds to boost spending when state funds are running low.
Texas politicians are well-skilled at figuring out how to squeeze every dollar they can from taxpayers, whether they get the money directly from us or through the federal government. The average annual spending growth of states funds during this period was 6%, while all funds spending grew by 5.75% annually.
But these numbers, from the Texas Legislative Budget Board, don’t show the true extent of state spending. On average, almost a third of state spending does not show up in the Legislature’s numbers. Figure 3 uses numbers from the Texas Comptroller’s office to show that in every two-year, or biennial, budget cycle since 2012-13, actual state spending has been at least 24% higher than the Legislature’s appropriations numbers. Using the difference between the Legislature’s and comptroller’s numbers , we can project total spending for the current 2024-25 biennium.
| Figure 3. Legislative Appropriations vs. Actual Spending | ||||
| Appropriations | Actual Spending | Difference | % | |
| 2012-13 | 185,254,700,000 | 241,974,151,000 | 56,719,451,000 | 30.62% |
| 2014-15 | 203,300,500,000 | 260,750,406,000 | 57,449,906,000 | 28.26% |
| 2016-17 | 216,398,400,000 | 284,309,764,000 | 67,911,364,000 | 31.38% |
| 2018-19 | 235,222,275,833 | 292,106,986,000 | 56,884,710,167 | 24.18% |
| 2020-21 | 270,340,500,000 | 413,554,629,000 | 143,214,129,000 | 52.98% |
| 2022-23 | 323,816,400,000 | 399,841,717,000 | 76,025,317,000 | 23.48% |
| Average | 76,367,479,528 | 31.82% | ||
Total legislative appropriations for the 2024-25 biennium were $321 billion. The comptroller estimates that the Legislature will appropriate another $2 billion for this biennium in its upcoming legislative session, for an estimated total appropriations of $323 billion. If we multiply that times 1.3182, the average difference between the Legislature’s and comptroller’s numbers, total spending from state and federal funds by the state of Texas is projected to be $424.1 billion this biennium. That will be the highest in state history, a 75.3% increase since 2012-13.
Politicians will often talk about tax cuts, but almost never talk about spending cuts. The truth is, though, that real, long-lasting tax cuts can only come through spending cuts. If government spending keeps growing, so will our taxes.
Texans for Fiscal Responsibility relies on the support of private donors across the Lone Star State in order to promote fiscal responsibility and pro-taxpayer government in Texas. Please consider supporting our efforts! Thank you!
Get The Fiscal Note, our free weekly roll-up on all the current events that could impact your wallet. Subscribe today!


